How to use Quick Test Professional IDE?
This tutorial introduces the Quick Test Professional IDE
Launch UFT
To launch HP QTP, In Start Menu,
Choose Programs > Quick Test Professional Folder > Quick Test Professional or double click on the HP UFT icon

Add-in Manager
The first time you start Micro Focus UFT, the Add-in Manager dialog box opens.
It Displays a list of all installed add-in. You can select the add-in you want to load for the test and click “OK”. You can later add or remove an Add-in after QTP has launched. For now, stick to default and move ahead

The recommendation you select only the add-ins required for your particular Testing session. Because at times, different add-in interferes with each other degrading object identification and QTP’s performance. QTP will remember the add-ins you load so that the next time you open QTP the add-ins you selected in the previous session is selected by default. Also, If you do not want this dialog box to open the next time you start QTP clear the Show on startup checkbox. Click OK.
Start Page
The Start Page describes the new features in the current release-including links to more information about these features. It also provides links to Process Guidance, a tool that offers best practices for working with QTP. You can open a document from the list of Recently Used Files, or you can click the buttons in the Welcome! an area to open new or existing documents.

Following are important components of the IDE
- Menu bar
- Properties window
- Document tab
- Solution Explorer
- Toolbox tab
- Output tab
- Active Screen
- Data tab
If you do not want QTP to display the Start Page when you next open QTP, select the “Don’t show the Start Page window on startup” checkbox. When you select this option, the Start Page is also automatically hidden for the current QTP session as soon as you open another QTP document. To display the Start Page again, select View > Start
Solution Explorer
The Solution Explorer is a hierarchical tree of all actions and tests in the current test, with their references, events, and flows.

Through Function Library, you can create a code or function that can be used numerous times in your test.
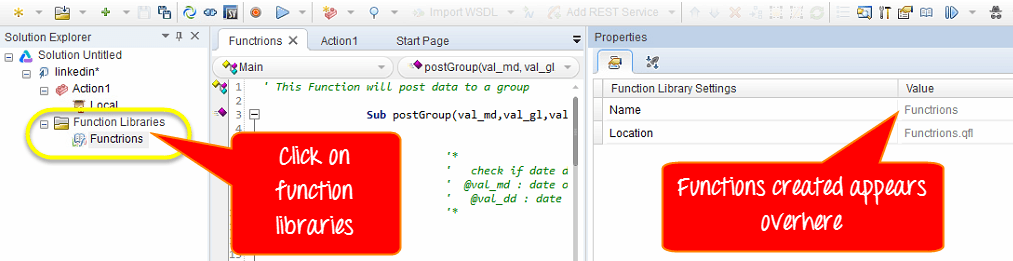
Detailed information of the function will appear on the right side of the panel under “Properties” panel
Data Table
You can enter the data related to your test through data-tab from the menu-bar at the bottom of the window. This panel is the tree hierarchy of data sources that can be used with a test.

The “Action” tab gives details of test code.

<
To view the errors encountered during performing Automation Testing, you can use the error tab from the bottom panel.

Move IDE Panes
You can move the QTP window panes to suit your own personal preferences.
Say we want to Move the Solution Explorer.
In the QTP window, drag the title bar of the Solution Explorer.
As you drag the pane, markers are displayed in the active pane and on each edge of the QTP window.
Drag the Solution Explorer and hold the cursor over the various markers. A shaded area is displayed, indicating the new location of the pane. Let’s move it to Top. Release the mouse button. The Solution Explorer Pane snaps into place and is displayed as a new pane in the shaded area.
