SAP Підручник з Crystal Reports
⚡ Розумний підсумок
SAP Crystal Reports is a business intelligence solution that creates analytical reports from SAP іSAP data sources. It supports Oracle, SQL Server, MySQL, Excel, and XML, enabling pixel-perfect reporting for accurate business decisions.
Що таке SAP Crystal Reports?
SAP Crystal Reports це BI-інструмент для створення аналітичних звітів SAP та інші не-SAP такі джерела даних, як Oracle, SQL Server, MySQL, Джерело даних XML, Microsoft Excel, and more. Knowledge of this tool helps businesses develop advanced reports and make accurate, profitable business decisions based on those reports.
В цьому SAP Підручник Crystal Reports для початківців, ви дізнаєтеся про основи Crystal Reporting:
Історія Crystal Reports
- Terry Cunningham and his peers created the software in 1991.
- У 1994 році компанія Crystal Services була придбана Seagate Technology.
- Програмне забезпечення Crystal Decisions було придбано компанією BusinessObjects у грудні 2003 року.
- In 2004, version 11 was released.
- SAP acquired BusinessObjects on October 8, 2007.
- Crystal Reports version 14.0 was released in 2011.
- Version 14.1 was released in 2013.
- Version 14.2 was released in 2016.
Компоненти Crystal Reports
Now in this section, you will learn about the main components of Crystal Reports.
Дизайн звіту Canvas helps you design the structure of your report. You can include different elements such as charts, text, and data objects in the report.
Правила
The Rules option displays a rule above the report canvas. The tool also allows you to change the unit of measurement by changing the unit option on the design canvas tab.
Режим структури
Structure mode and Page mode help you define the layout of the reports. Each object in the structure mode is represented by a frame.
Нижче наведено важливі компоненти режиму структури:
Режим структури Компоненти
| Назва компонента | Деталі |
|---|---|
| Заголовок звіту | Used for adding a report title at the top, or any other information you want to include at the start of the report. |
| Заголовок сторінки | The page header presents information at the top of each page. The header section generally includes the document heading, chapter name, and similar details. |
| Колонтитул сторінки | Used to present page numbers or any other information at the end of each page. |
| Body | У цьому розділі відображається основна частина звіту. Усі дані звіту повинні бути включені в цей розділ. |
| Режим сторінки | Page mode view represents the actual data in the report as it will appear when the report is published or printed. |
джерела даних
Crystal Reports helps you connect to multiple data sources, which include:
- Перегляд HANA
- Реляційні зв’язки
- SAP Запит BEx
- Електронні таблиці Excel
Крок 1) Connect to the data source.
Go to File -> New -> From Data Source.
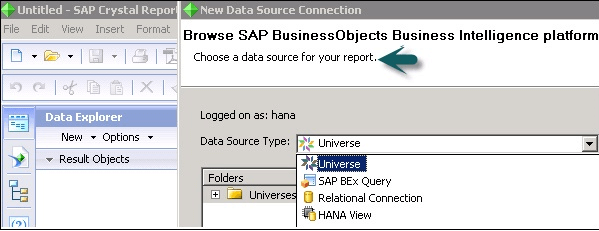
Крок 2) Select the data source.
Щоб вибрати джерело даних, необхідно підключитися до SAP Сервер платформи Business Objects.
Крок 3) Check the Data Source Type list.
File -> New -> From Data Source -> Choose a data source connection dialog box appears -> Browse Repository -> Data Source Type list -> Select the data source you want to connect -> Next.
Особливості Crystal Reports
Нижче наведено особливості SAP Crystal Reports:
- Allows you to interact with various data sources.
- Avoids the intervention of middle layers such as Universes.
- Легка взаємодія з SAP ХАНА.
- Powerful report design.
- Flexible application development.
- Report management and delivery.
- Administration via a web interface.
- Easy navigation system.
- Tracks information and keeps data organized.
- Live connection to external data.
- Multi-data source reporting.
- OLAP (pre-processed cube representation).
- ROLAP (SQL-layer querying).
Використання Crystal Report
SAP Crystal Reports використовується дляtract custom analytical reports from various data sources. Crystal Reports also helps businesses create a database reporting environment to access data, format data, view data, and integrate reports with various applications so that the reports are available to all users in the organization.
Crystal Reports – Навігація графічним інтерфейсом
Crystal Reports for enterprise offers an interface that allows you to create, format, and publish effective reports. The menu bar of Crystal Reports provides a wide range of features shown in the following image.
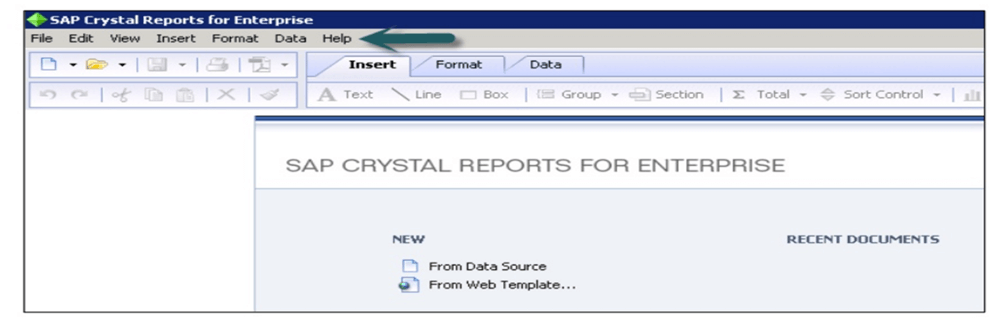
The Insert tab helps you insert an object into your report, such as text, lines, boxes, groups, sections, pictures, and charts.
The Format tab helps you use functions for formatting the selected file, such as changing the size or font, the background color, and alignment of text to center, left, or right.
Crystal Reports supports conditional formatting, such as highlighting values above or below a particular threshold in the report.
When you select a conditional formatting option at the top right corner, you can set the formatting box. In this box, you can give the condition under which the conditional formatting will appear.
Які переваги Crystal Report?
Here are the benefits and advantages of using SAP Crystal Reports:
- Дозволяє створювати високоякісні звіти за допомогою SAP Crystal Reports through an easy design interface and efficient workflows.
- Helps you build personalized reports in your preferred language and format.
- You can connect to information sources directly, including native data, OLE DB, ODBC, and JDBC connectivity to relational databases, OLAP, web services, and more.
- Helps you export more data to a single worksheet without extending it to multiple sheets.
- Allows you to open interactive reports through your mobile devices.
- Helps you produce a report from virtually any data source.
- Дозволяє аналізувати та інтерпретувати важливу інформацію.
- Data connection procedures are straightforward.
- Helps you access trusted data.
- Allows you to navigate to the lowest level of data granularity.
- Helps you create a customized reporting view that you need for your business.
Які недоліки Crystal Reports?
Here are the drawbacks and cons of using SAP Crystal Reports:
- Crystal Reports is not very user-friendly for learning, as error decryption is tedious and hard to figure out.
- Using sub-reports embedded with main reports for different views of the same data sourced from different tables makes the entire process very slow.
- Безпека часом є великою проблемою під час доступу до даних.
- A new version of Crystal Reports does not always work with older engines.
- Incorporating reports into webpages sometimes crashes the application.
- Для нормальної роботи програмного забезпечення завжди потрібне стабільне підключення до Інтернету.
- Компанія не пропонує жодного безкоштовного пробного плану.